
Shropshire Covid-19 rate revealed as hospitals go 12 days without virus death
The rate of new coronovirus cases in Shropshire has been revealed in new government figures.

The fresh government data, which will be used to make decisions on imposing local lockdowns when rates rise across the country, comes as the last recorded Covid-19 death at a Shropshire NHS health trust was now 12 days ago.
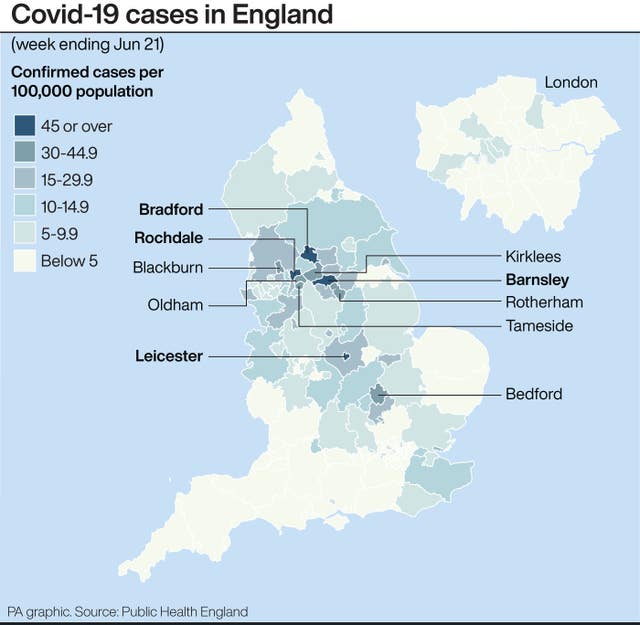
The latest Public Health England snapshot is for the week ending June 21 and shows a rate of new weekly cases of 13.7 per 100,000 people in Shropshire and of 8.4 in Telford & Wrekin.
In Leicester, where a 'local lockdown' has seen fresh restrictions imposed, the rate was 140.2. That is more than double the rate of Bradford, which is second highest on the list with a rate of 69.4.

Barnsley and Rochdale are third and fourth on the list with rates of 54.7 and 53.6 respectively.
In the West Midlands, Stoke-on-Trent had the highest rate with 18 new cases per 100,000 people while Wolverhampton's rate was 9.9 and Birmingham's 9.6.
In Shropshire the official combined coronavirus death toll remains at 323, with no new deaths announced in hospitals for more than week.
A total of 184 people have died at the county's NHS health trusts – 165 at Shrewsbury & Telford Hospital NHS Trust, 14 at Shropshire Community Health Trust, and five at the Robert Jones and Agnes Hunt Orthopaedic Hospital near Oswestry.
Data from the Office for National Statistics (ONS) also shows 139 people have died with Covid-19 in care homes in the county, with 95 of these in the Shropshire authority area and 44 in Telford & Wrekin.
More Covid-19 coverage:
In Powys 90 people have died with the virus, according to ONS data.
Meanwhile the UK death toll, which includes deaths in and out of hospitals, increased by 176 to 43,906 today.
The figures on coronavirus rates, published by Public Health England, show the rate of new cases in each area, based on tests that have been carried out in laboratories (‘pillar 1’ of the Government’s testing programme) and in the wider community (‘pillar 2’).
As such the figures gives a more comprehensive overview of the country than the daily figures for local areas that are published on the Department of Health website, which are based only on pillar 1 testing.
See the full list of case rates from across the UK below:
The figures, published by Public Health England, show the rate of new cases in each area, based on tests that have been carried out in laboratories (‘pillar 1’ of the Government’s testing programme) and in the wider community (‘pillar 2’).
As such the figures gives a more comprehensive overview of the country than the daily figures for local areas that are published on the Department of Health website, which are based only on pillar 1 testing.
The latest Public Health England snapshot is for the week ending June 21.
Here is the full list, showing the number of cases per 100,000 population:
Leicester 140.2
Bradford 69.4
Barnsley 54.7
Rochdale 53.6
Bedford 42.0
Oldham 38.6
Rotherham 33.6
Tameside 33.3
Blackburn with Darwen 32.9
Kirklees 30.3
Peterborough 27.9
Luton 26.6
Derby 24.5
Hull 22.6
Manchester 21.6
Southend-on-Sea 20.8
Leicestershire 20.8
Sheffield 20.6
Leeds 19.8
Wirral 19.2
Wakefield 18.6
Stoke-on-Trent 18.0
Doncaster 17.4
Cheshire East 16.0
Central Bedfordshire 15.9
Bolton 15.8
Lancashire 15.0
Northamptonshire 14.9
Stockton-on-Tees 14.7
East Riding of Yorkshire 14.1
North Yorkshire 13.8
Shropshire 13.7
Kent 13.5
Slough 13.4
Bury 13.2
Nottinghamshire 12.6
Calderdale 12.4
Stockport 12.3
Cheshire West & Chester 12.3
Thurrock 12.2
Milton Keynes 10.8
Blackpool 10.8
Nottingham 10.6
Swindon 10.4
Warwickshire 10.3
Salford 10.2
Trafford 10.2
Wolverhampton 9.9
Derbyshire 9.7
Birmingham 9.6
Staffordshire 9.4
Warrington 9.1
East Sussex 9.0
Telford & Wrekin 8.4
Sefton 8.4
Middlesbrough 7.8
Kensington & Chelsea 7.7
Hounslow 7.4
Sandwell 7.3
York 6.7
St. Helens 6.7
Liverpool 6.3
Halton 6.2
Medway 6.1
Buckinghamshire 6.1
Knowsley 6.0
Hammersmith & Fulham 5.9
Essex 5.8
Cumbria 5.8
Worcestershire 5.7
Coventry 5.7
Lincolnshire 5.7
Southampton 5.5
Wigan 5.5
Waltham Forest 5.4
Newcastle upon Tyne 5.3
Brighton & Hove 5.2
Brent 5.1
County Durham 5.1
Oxfordshire 5.1
Westminster 5.1
Cambridgeshire 5.1
North Tyneside 4.9
Darlington 4.7
North Lincolnshire 4.7
Solihull 4.7
Somerset 4.7
Hertfordshire 4.6
Walsall 4.6
Bexley 4.5
Merton 4.4
Norfolk 4.3
Hartlepool 4.3
Bracknell Forest 4.1
Ealing 4.1
Dudley 3.7
Surrey 3.7
Redbridge 3.6
Southwark 3.5
Gateshead 3.5
Northumberland 3.4
Newham 3.4
West Sussex 3.3
Greenwich 3.1
Islington 2.9
Isle of Wight 2.8
Tower Hamlets 2.8
Wandsworth 2.8
Enfield 2.7
Hillingdon 2.6
Haringey 2.6
Rutland 2.5
Hackney 2.5
Barnet 2.3
Bromley 2.1
Herefordshire 2.1
Windsor and Maidenhead 2.0
Lewisham 2.0
Sutton 2.0
Bristol 1.9
Havering 1.9
Camden 1.9
North East Lincolnshire 1.9
Reading 1.8
Sunderland 1.8
Harrow 1.6
Croydon 1.6
Plymouth 1.5
Suffolk 1.5
Barking & Dagenham 1.4
North Somerset 1.4
Bournemouth, Christchurch & Poole 1.3
Hampshire 1.2
Wiltshire 1.2
Kingston upon Thames 1.1
Dorset 1.1
Bath & North East Somerset 1.0
Richmond upon Thames 1.0
Devon 1.0
Portsmouth 0.9
Lambeth 0.9
Torbay 0.7
Redcar & Cleveland 0.7
Cornwall & Isles of Scilly 0.7
Gloucestershire 0.6
Wokingham 0.6
South Gloucestershire 0.4
City of London 0.0
South Tyneside 0.0
West Berkshire 0.0


