What the latest NHS hospital figures for England show
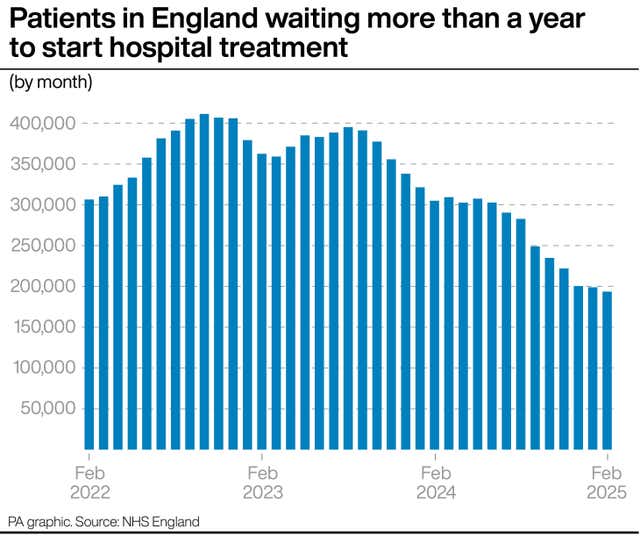
Some 193,516 people had been waiting more than a year for hospital treatment at the end of February.

The NHS has published its latest monthly performance data for hospitals in England, including the number of people waiting for treatment, delays in A&E and cancer referrals.
Here, the PA news agency looks at the key figures:
– Overall waiting list
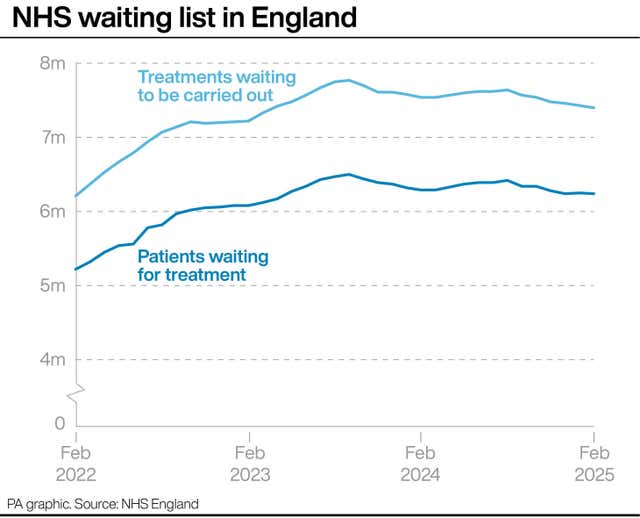
The waiting list for routine hospital treatment has fallen for the sixth month in a row.
An estimated 7.40 million treatments were waiting to be carried out at the end of February, relating to 6.24 million patients.
This is down from 7.43 million treatments and 6.25 million patients at the end of January.
The list hit a record high in September 2023, with 7.77 million treatments and 6.50 million patients.
The size of the list has been on an upwards trend for much of the last 10 years, passing three million treatments in 2014, four million in 2017, five million in 2021 and seven million in 2022.
In February 2020, the last full month before the start of the Covid-19 pandemic, the list stood at 4.57 million treatments.
– Long waits for treatment
Some 1,691 patients had been waiting more than 18 months to start routine treatment at the end of February, down from 2,005 in January.
A year earlier, in February 2024, the number stood at 9,969.
There were 13,223 patients who had been waiting more than 65 weeks to start treatment, down from 14,975 the previous month.
This figure stood at 75,004 in February 2024.
A total of 193,516 people had been waiting more than 52 weeks to start routine hospital treatment at the end of February, down from 198,868 at the end of January and the lowest number since November 2020.
Some 2.6% of people on the waiting list for hospital treatment had been waiting more than 52 weeks in February, down from 2.7% in January and from 4.0% a year earlier in February 2024.
The Government and NHS England have set a target of March 2026 for this figure to be reduced to less than 1%.
– Accident and emergency waits
Some 75.0% of patients were seen within four hours in A&Es last month, up from 73.4% in February.
The Government and NHS England have set a target of March 2026 for 78% of patients attending A&E to be admitted, discharged or transferred within four hours.
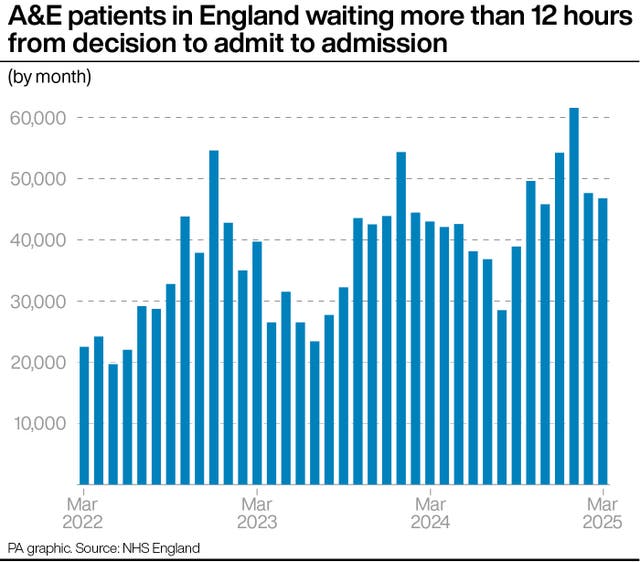
The number of people waiting more than 12 hours in A&E departments from a decision to admit to actually being admitted stood at 46,766 in March, down slightly from 47,623 in February.
The number waiting at least four hours from the decision to admit to admission rose slightly, standing at 133,957 in March, up from 131,237 in February.
– Cancer referrals
A total of 80.2% of patients urgently referred for suspected cancer were diagnosed or had cancer ruled out within 28 days in February.
This is up from 73.4% the previous month and is the highest since the measure was introduced in April 2021.
The Government and NHS England had set a target of March 2026 for this figure to reach 80%.
Meanwhile, the proportion of patients who had waited no longer than 62 days in February from an urgent suspected cancer referral, or consultant upgrade, to their first definitive treatment for cancer was 67.0%, down slightly from 67.3%.
The Government and NHS England have set a target of March 2026 for this figure to reach 75%.
GPs in England made 252,308 urgent cancer referrals in February, down slightly from 255,162 in January and down year on year from 253,787 in February 2024.
– Ambulance response times
The average response time in March for ambulances dealing with the most urgent incidents, defined as calls from people with life-threatening illnesses or injuries, was seven minutes and 52 seconds.
This is down from eight minutes and four seconds in February, and is the quickest time since May 2021 – but it remains above the target standard response time of seven minutes.
Ambulances took an average of 28 minutes and 34 seconds last month to respond to emergency calls such as heart attacks, strokes and sepsis.
This is down from 31 minutes and 22 seconds in February.
The Government and NHS England have set a new target for this figure to average 30 minutes across 2025/26.
Response times for urgent calls, such as late stages of labour, non-severe burns and diabetes, averaged one hour, 36 minutes and 17 seconds in March, down from one hour, 50 minutes and 52 seconds in February.
– Diagnostic tests
Nearly 300,000 people had been waiting longer than six weeks for a key diagnostic test in February.
Some 291,346 patients, 17.5% of the total, were waiting longer than six weeks for one of 15 standard tests, including an MRI scan, non-obstetric ultrasound or gastroscopy.
It is the lowest monthly figure since March 2020 and is down from 363,612 (22.4% of the total) in January.